MR ANGIOGRAPHY:
TECHNIQUES AND APPLICATIONS
John R. Hesselink, MD, FACR

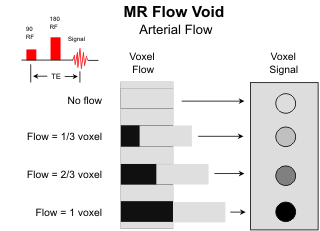
The ability of MR to image the cerebral vasculature continues to evolve and improve. Arteries are routinely visible on spin-echo images due to the "flow void" phenomenon. In order to collect a signal from flowing fluids, the protons must remain within the imaging volume for both the initial 90o and the following 180o refocusing radiofrequency (rf) pulses. In the case of rapid arterial flow, the protons leave the imaging volume between the two rf pulses, no signal is collected, and the arteries are rendered dark on the MR image. The flow-related signal loss is more likely to occur with pulse sequences using long echo times. On T2-weighted images the dark vessels are contrasted nicely with the high signal CSF within the cisterns and the intermediate signal of the brain parenchymal.
The "flow void" phenomenon is very helpful in evaluating cerebral vascular disease. Since normally the arteries are dark, the presence of any intraluminal signal suggests either a high-grade stenosis or thrombosis. Also, arteriovenous malforma
-tions (AVM) are readily detected on noncontrast MR scans because of the high flow through these lesions. Dilated vascular structures often identify the arterial supply and the venous drainage of the nidus of the malformation. Giant aneurysms (≥2.5 cm) are clearly imaged on MR. Smaller aneurysms are more of a challenge; thin sections and multiplanar imaging increases the yield.
Another flow phenomenon commonly observed on spin-echo MR images is "flow enhancement." In this case the flow is sufficiently slow that the majority of protons stay within the imaging volume long enough to receive both rf pulses, so the signal loss is negligible. In addition, between the 180o rf pulse and the next 90o pulse, fresh, fully relaxed protons move into the slice volume from adjacent areas. These protons have never experienced an rf pulse before. As a result, with the next 90-180o rf pair they yield more signal than the partially saturated protons in the stationary tissues. Flow enhancement is to be expected in the cerebral veins and intracranial venous sinuses. With multislice spin-echo sequences, it is limited to the end slices where flow is directed into the imaging volume.
Flow enhancement is augmented with gradient-echo (GRE) sequences because the echo times are shorter and no 180o rf pulse is used. The spins are refocused with gradients. GRE images are very helpful for assessing intracranial sinus thrombosis. Arteries also exhibit high signal intensity on GRE images. The signal is captured from arterial flow because the spins need stay around for only the initial rf pulse; subsequent gradient pulses are not slice selective. Since the spins within the imaging
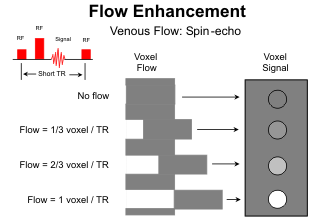
volume are rapidly refreshed by the arterial flow after each rf pulse, contrast between the arteries and adjacent tissues can be increased by shortening the repetition time (TR) to further saturate the stationary protons. Prior to MR angiography (MRA), GRE sequences were commonly used to evaluate both arterial and venous vascular lesions of the brain. GRE sequences are the basis for MRA.
MRA TECHNIQUES
The two primary methods for MRA are time-of-flight and phase contrast. Technically, they are
very different, and each has advantages and disadvantages. 2D or 3D volume acquisitions can be
employed with both methods.
![]()
2D Time-of-Flight
For this technique, multiple contiguous thin-section (1.5 mm) GRE images are acquired, and the images are stacked to make a volume set. The 2D GRE images can be viewed individually, or the volume set can be summed to give a "collapse" image. The collapse image is most helpful for displaying thin-volume sets through the circle of Willis and for selecting regions of interest for segmented reconstructions. For the MR angiogram, the volume data set is subjected to a maximum intensity projection (MIP) ray tracing algorithm to display the vessels from multiple angled views 180o around an axis perpendicular to the original acquisition plane. In general, an imaging plane is selected perpendicular to the direction of flow within the vessels to maximize the inflow enhancement effect. For the carotid and vertebral arteries, the images are acquired in the axial plane and the MIP angiograms are viewed from frontal to lateral projections (usually 18 projection angiograms at 10 degree increments). Adjacent angled projections can be viewed as stereo pairs, or the images can be displayed in a cine mode to give a visual 3-dimensional appearance.
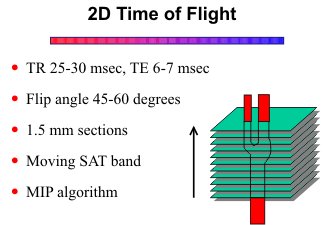
Since the slices are acquired one at a time, for arterial imaging the TR can be quite short (25-30 msec) and the flip angle quite large (45-60 degrees) without noticeable signal loss from saturation effects, except for in-plane flow. With one signal average and a 128 x 256 matrix, the imaging times range from 5 to 7 minutes, depending on the number of slices.
When the vessels are perpendicular to the acquisition plane, the arteries or veins can be selected by prescribing presaturation (SAT) rf pulses. For example, for imaging the carotid arteries in the neck, a SAT band is placed superior to the imaging plane to saturate venous flow from above. The SAT band moves with each successive axial slice to stay a few millimeters above the slice being acquired. To image the jugular veins in the neck, the SAT band would be placed inferior to the image plane.
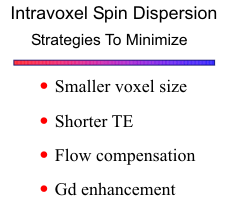
All MRA sequences suffer signal loss due to intravoxel spin-phase dispersion or phase incoherence. These phase shift effects occur when protons within a voxel accumulate varying phase from magnetic field inhomogeneity, susceptibility effects, a range of velocities within a voxel, acceleration, or turbulence. Signal loss from intravoxel phase dispersion can be minimized by using the smallest voxel size, minimum TE (8-9 mm for 2D TOF), and 1st order flow compensation.
3D Time-of-Flight
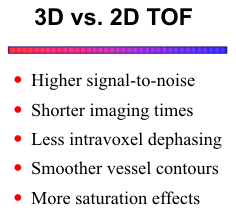
This method is similar to 2D TOF except that the data
is collected as a 3D volume set rather than individual slices.
The data is processed by the MIP technique to obtain the
final angiographic images. The 3D acquisition allows for
thinner slices (0.7 vs 1.5 mm), and therefore a smaller voxel
size, which along with a shorter TE (<5 msec) results in
less intravoxel dephasing. Compared to the 2D method,
3D TOF provides higher signal-to-noise and shorter
imaging times. On the other hand, volume methods are
more susceptible to saturation effects because unsaturated
spins from outside the volume may have to travel a few
centimeters into the imaging volume to produce flow
enhancement. Saturation effects can be minimized in 3D
TOF MRA by using the thinnest volume to encompass the
vessels of interest, lower flip angles (15-20 degrees), and longer TRs (TR of 40 msec is standard).
![]() Rather than collecting the entire volume at once, a limited number of overlapping slabs can be
acquired sequentially to reduce saturation effects, but this technique increases imaging time and
reconstruction time. Gd-enhancement can be used to shorten the T1 relaxation time of the blood and
reduce saturation through the imaging volume, but it also increases the signal from stationary tissues.
Rather than collecting the entire volume at once, a limited number of overlapping slabs can be
acquired sequentially to reduce saturation effects, but this technique increases imaging time and
reconstruction time. Gd-enhancement can be used to shorten the T1 relaxation time of the blood and
reduce saturation through the imaging volume, but it also increases the signal from stationary tissues.
![]() Magnetization transfer is a novel method that improves vascular contrast by suppressing background
tissues.
Magnetization transfer is a novel method that improves vascular contrast by suppressing background
tissues.
![]() 3D TOF works well for high flow arterial systems, such as the circle of Willis. Saturation
effects limit its utility for imaging the venous side of the circulation.
3D TOF works well for high flow arterial systems, such as the circle of Willis. Saturation
effects limit its utility for imaging the venous side of the circulation.
2D Phase Contrast
Phase contrast (PC) methods use an entirely different technique to generate vascular contrast.
Following the initial 90o rf pulse, bipolar phase-encoding gradients are applied separately along the
three axes to impart phase shifts to moving protons. Protons in stationary tissues acquire no net
phase change with the bipolar gradient pulses, but flowing protons within vessels accumulate phase
as they move through the gradient fields. For a second excitation, the polarity of the bipolar gradient
is inverted. A vector subtraction technique essentially eliminates background signal, yielding high
contrast angiograms with PC methods.
![]()
Another important parameter in PC is the velocity encoding (VENC) factor, which can be set to select out arteries or veins. Higher VENC factors (60-80 cm/sec) will selectively image the arteries, whereas a VENC factor of 20 cm/sec will highlight the veins and sinuses.
2D PC collects and displays data as a series of thick slices or a single slab. The data is not
processed by the MIP algorithm but rather viewed as a single projection in the plane of acquisition,
similar to a collapse image. One major benefit of this MRA sequence is that the phase images can
be displayed to show direction of flow. This information may be useful for assessing collateral flow
about the circle of Willis in cases of carotid or vertebrobasilar occlusive disease or for showing
direction of flow to and from AVMs. Potentially more important, PC sequences can quantify
velocities within a vessel. If the cross-sectional area is measured, flow can be calculated. Flow data
is valuable for assessing occlusive vascular disease
![]() and likely will have a role in measuring blood flow
to AVMs before and following partial resection, embolization, or radiation therapy.
and likely will have a role in measuring blood flow
to AVMs before and following partial resection, embolization, or radiation therapy.
![]()
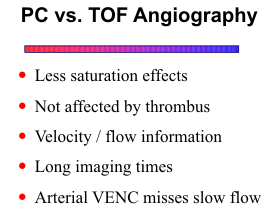
Since PC methods are less susceptible to saturation effects, very short TRs can be used (≤25 msec). With 2D PC, imaging time can be reduced to 3 minutes or less, or the NEX can be increased to improve signal-to-noise. PC methods are equally sensitive to intravoxel dephasing as TOF techniques. As mentioned above, signal loss can be minimized by reducing voxel size and using flow compensation and minimum TE.
3D Phase Contrast
3D PC is similar to 2D except that volume acquisition is employed, multiple thin slices (0.7-1.0 mm) are stacked, and the MIP algorithm is used to generate projection angiograms from multiple angles. By using short TRs and lower flip angles (15-20 degrees), the entire head can be imaged with relatively little signal loss from saturation effects, but the imaging times can be quite long (20-30 minutes). Usually, the volume size is limited to the region of interest to maintain reasonable imaging times. Visualization of more distal smaller arteries can be improved with Gd-enhancement without the offsetting effect of increased signal from stationary tissues observed with TOF techniques.
Gd-Enhanced MRA
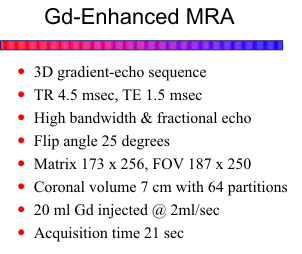
This novel technique uses a 3D fast gradient-echo sequence (FLASH or SPGR) in conjunction
with a bolus injection of gadolinium. A short TR (4.5 msec) and minimum TE are used with a flip
angle of 25 degrees. A high bandwidth, no flow compensation and fractional echo allow for echo
times at short as 1.5 msec to ensure rapid collection of maximum signal. A 7 cm coronal volume is
acquired with 64 partitions. A typical matrix size is 175 x 256 with a 190 x 256 field-of-view. About
20 ml of gadolinium is injected at a rate of 2 ml/sec. The acquisition is carefully timed during passage
of the bolus of gadolinium through the arteries of interest. A preliminary test injection of gadolinium
can be done to time the arrival of contrast into the arteries. With newer ultra-fast scanners, a fluoro
technique can be used to monitor the region of interest in real time and start the acquisition when
contrast is first seen. Acquisition time is less than 25 seconds.
![]()
PROBLEMS AND PITFALLS
As with any imaging technique, MRA has its own artifacts and problems which must be recognized in order to avoid misdiagnosis. In general, MRA displays beautiful normal anatomy, but in the presence of significant vascular disease, technical shortcomings may surface. Pulse sequences can be adjusted to minimize these adverse effects, or a combination of MRA techniques can be used to distinguish artifacts from real disease.
Complex Flow
Turbulence, nonlaminar flow, flow separation, vortex flow, eddy motion, collectively called "complex flow", result in intravoxel phase dispersion and loss of signal on both TOF and PC MRA. The signal dropout causes defects in the vascular image that simulate disease. This effect is often observed in the petrous and cavernous segments of the carotid arteries. It is more of a problem with 2D methods because of larger voxel size and longer minimum TEs. Unfortunately, complex flow is also common at sites of stenosis, areas that must be visualized in order to make sound clinical judgments. Of the four MRA methods, 3D TOF is affected least by complex flow signal loss because of small voxel size and the shortest TE.
Slow Flow
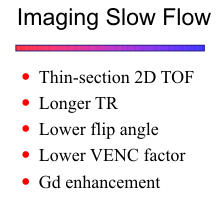
Significant vascular stenoses often result in slow flow distal to the site of stenosis. The reduced velocities produce increased saturation effects within the imaging volume and decreased signal intensity within the vessel lumen. In cases of severe stenosis with markedly reduced distal flow, intraluminal signal may become imperceptible and simulate a complete occlusion. Slow-flow signal loss is particularly a problem with 3D TOF imaging of vessels deep within the imaging volume. Similarly with 2D TOF, vessels flowing transversely within the slice plane are more likely to show saturation effects. The MIP processing technique contributes to the problem because it ignores low signal intensities that fall below a certain threshold. With PC techniques, normally effective arterial VENC factors may fail to image slow flow distal to a stenosis.
Flow Stasis and Recirculation
These flow phenomena occur normally within the carotid bulb, and also in diseased vessels, such as beyond an area of stenosis, in large ulcerations, and aneurysms. They result in signal loss due to saturation effects and intravoxel dephasing. Corrective measures mentioned above are partially successful at imaging these difficult areas of vascular anatomy.
Thrombus
Blood degradation products can interfere with vascular imaging. Methemoglobin within thrombus has a short T1 relaxation time and generates high signal intensity on TOF images, simulating intraluminal flow. PC contrast methods are not affected by methemoglobin and can be used to distinguish thrombus from flow. Both TOF and PC MRA are subject to signal loss from the magnetic susceptibility effects of deoxyhemoglobin and hemosiderin/ferritin. This is mostly a problem in partially thrombosed aneurysms. The patent lumen of the aneurysm may be obscured or the margins of the residual lumen may appear indistinct.
Advantages of Contrast MRA
Gd-enhanced MRA is a very robust technique that solves many of the problems associated with noncontrast time-of-flight and phase-contrast methods. Large fields of view can be used to image the cervical-cranial circulation from the aortic arch all the way superiorly to the circle of Willis. The addition of gadolinium essentially eliminates problem of saturation effects from slow flow and stasis. The very short TE markedly reduces signal loss due to complex flow and intravoxel phase dispersion.
CLINICAL APPLICATIONS
Arterial Occlusive Disease
A major application for MRA is screening the carotid arteries for arteriosclerotic disease.
![]() Stroke
is the third most common cause of death in the United States. A common source of TIA and stroke
is atheromatous disease at the carotid bifurcation in the neck. Since the NASCET (North American
Symptomatic Carotid Endarterectomy Trial) study
Stroke
is the third most common cause of death in the United States. A common source of TIA and stroke
is atheromatous disease at the carotid bifurcation in the neck. Since the NASCET (North American
Symptomatic Carotid Endarterectomy Trial) study
![]() has proved the efficacy of carotid
endarterectomy for stenoses ≥70%, accurate assessment of the carotid artery is of paramount
importance.
has proved the efficacy of carotid
endarterectomy for stenoses ≥70%, accurate assessment of the carotid artery is of paramount
importance.
Gd-enhanced MRA has replaced TOF and PC methods for imaging the neck vessels. It is faster
and more robust than the non-contrast techniques. The ability to visualize the arteries from their
origins at the aortic arch all the way to the circle of Willis makes it possible to do a complete vascular
assessment. Gd-enhanced MRA is far superior for imaging high-grade stenoses and for visualizing
slow distal flow. Signal loss from flow stasis or swirling within the carotid bulb is not a problem with
this technique. Since no superior SAT pulses are needed to suppress venous structures, no saturation
occurs in vascular loops.
![]()
Another application of MRA is in cases of suspected dissection. Relatively minor trauma is
sufficient to cause a dissection, or it can be spontaneous. The MRA may demonstrate complete
occlusion or only narrowing of the arterial lumen. Spin-echo images should also be obtained because
they are very sensitive for detecting the intramural hemorrhage. The typical appearance of an oval-shaped hyperintensity with an eccentrically placed flow void may be more convincing for a dissection
than the MRA. The MRA is very useful for following a dissection to look for recanalization of a
complete occlusion or resolution of the vascular compromise caused by the intramural thrombus.
![]()
MRA can also evaluate the major intracranial arteries about the circle of Willis.
![]() Most protocols
use a 3D TOF sequence. Using MOTSA (multiple overlapping thin slabs) with 3D TOF techniques
reduces saturation effects and allows visualization of more distal arteries. Intracranial MRA is a very
acceptable method for imaging the vertebrobasilar system, which is inaccessible to ultrasound and has
no effective surgical therapy.
Most protocols
use a 3D TOF sequence. Using MOTSA (multiple overlapping thin slabs) with 3D TOF techniques
reduces saturation effects and allows visualization of more distal arteries. Intracranial MRA is a very
acceptable method for imaging the vertebrobasilar system, which is inaccessible to ultrasound and has
no effective surgical therapy.
![]() The phase images of 2D PC MRA can be used to determine direction
of collateral flow about the circle of Willis.
The phase images of 2D PC MRA can be used to determine direction
of collateral flow about the circle of Willis.
When reading MR angiograms, it is important to remember that non-contrast TOF techniques place an rf saturation (SAT) pulse above the imaging plane to eliminate signal from venous structures flowing inferiorly. If any arteries happen to flow from superior to inferior, they will also be masked. For example, retrograde flow in a vertebral artery secondary to a subclavian steal phenomenon will not be visualized. Similarly, retrograde filling of a carotid artery or the basilar artery in the presence of severe proximal disease may not be imaged and lead to misdiagnosis of occlusion. A vascular loop can also result in loss of signal. 2D TOF is more susceptible to these artifacts because the SAT band is placed about 5 mm above each successive image slice. Misdiagnosis of occlusion can be avoided in these situations by repeating the TOF sequence with no SAT band or by doing a Gd-enhanced MRA or a PC study.

Venous Occlusive Disease
MRA is very effective in evaluating intracranial veno-occlusive disease, such as superior sagittal
sinus thrombosis.
![]() PC methods with lower VENC factors (20 cm/sec) work well for this disease and
avoid any possible confusion with thrombus. 2D PC can image the full extent of the sagittal sinus in
only a few minutes. Despite the problem with thrombus, 2D TOF is still commonly used for
evaluated venous occlusive disease. If patients are imaged within the first two days, minimal
methemoglobin will be present within the clot. Also, by correlating the MRA images with the T2 and
T1-weighted images, a definitive statement can be made about patency or occlusion of the veins and
sinuses.
PC methods with lower VENC factors (20 cm/sec) work well for this disease and
avoid any possible confusion with thrombus. 2D PC can image the full extent of the sagittal sinus in
only a few minutes. Despite the problem with thrombus, 2D TOF is still commonly used for
evaluated venous occlusive disease. If patients are imaged within the first two days, minimal
methemoglobin will be present within the clot. Also, by correlating the MRA images with the T2 and
T1-weighted images, a definitive statement can be made about patency or occlusion of the veins and
sinuses.
Aneurysms
Another application for MRA is screening for intracranial aneurysms in asymptomatic patients
who have a family history of aneurysms or who have polycystic kidneys, coarctation of the aorta, or
collagen vascular disease, putting them at a higher risk for aneurysms.
![]() 3D TOF or PC is
recommended for screening for aneurysms around the circle of Willis. Relatively small imaging
volumes can be used to keep imaging times short. Aneurysms 5 mm and larger are detected reliably
on good quality studies.
3D TOF or PC is
recommended for screening for aneurysms around the circle of Willis. Relatively small imaging
volumes can be used to keep imaging times short. Aneurysms 5 mm and larger are detected reliably
on good quality studies.
![]() Depending on the size of the aneurysm neck and local hemodynamics, the
entire aneurysm lumen may be rendered hyperintense, or an internal flow jet may be observed similar
to the first film of a conventional angiographic sequence. The flow jets can be seen as high or low
signal intensity, depending on the flow dynamics and the MRA parameters used. Potentially slow
flow areas, such as the anterior and posterior communicating arteries, may not be visualized. The
resolution of MRA is insufficient to accurately define the aneurysm neck or adjacent perforating
arteries for presurgical planning.
Depending on the size of the aneurysm neck and local hemodynamics, the
entire aneurysm lumen may be rendered hyperintense, or an internal flow jet may be observed similar
to the first film of a conventional angiographic sequence. The flow jets can be seen as high or low
signal intensity, depending on the flow dynamics and the MRA parameters used. Potentially slow
flow areas, such as the anterior and posterior communicating arteries, may not be visualized. The
resolution of MRA is insufficient to accurately define the aneurysm neck or adjacent perforating
arteries for presurgical planning.
To avoid errors in diagnosis, all images should be reviewed, including the individual 2D sections
or partitions, the collapse image, and the projection images of the MRA, as well as any available spin-echo scans. Using this approach to screen for aneurysms about the circle of Willis, a sensitivity of
86-95% can be achieved for aneurysms 5 mm or larger,
![]() but the sensitivity decreases to 56% for
smaller aneurysms.
but the sensitivity decreases to 56% for
smaller aneurysms.
![]() Patients must be informed that a normal MRA does not absolutely exclude an
aneurysm. Conventional angiography remains the definitive procedure. For the same reason, MRA
is not recommended in patients with documented subarachnoid hemorrhage.
Patients must be informed that a normal MRA does not absolutely exclude an
aneurysm. Conventional angiography remains the definitive procedure. For the same reason, MRA
is not recommended in patients with documented subarachnoid hemorrhage.
Giant aneurysms are usually readily apparent on spin-echo images. MRA can help identify any residual patent lumen and the parent artery. As mentioned before, intraluminal clot and flow stasis may cause signal loss and obscure the vascular anatomy. Spin saturation is especially a problem for TOF sequences in the larger aneurysms, and 3D PC may be superior to 3D TOF in depicting giant aneurysms. Also, since the MIP algorithm selects for maximum intensities, an aneurysm that is faintly visible on the collapse image, may not be displayed on the projection images.
Arteriovenous Malformations
The best MRA sequences for depicting the anatomy of AVMs are 3D TOF and PC methods. The
TOF technique may not show the draining veins in their entirety due to saturation effects.
![]() Gd will
improve venous visualization, but in general, PC is better for imaging the venous side of AVMs. By
using two different VENC factors, 80 and 20 cm/sec, arterial and venous phase images can be
generated. High flow through these lesions often produce turbulence and some signal loss within the
feeding arteries. As discussed earlier, selective saturation pulses can be used to isolate arterial supply
to AVMs.
Gd will
improve venous visualization, but in general, PC is better for imaging the venous side of AVMs. By
using two different VENC factors, 80 and 20 cm/sec, arterial and venous phase images can be
generated. High flow through these lesions often produce turbulence and some signal loss within the
feeding arteries. As discussed earlier, selective saturation pulses can be used to isolate arterial supply
to AVMs.
Flow voids from AV shunting helps identify AVMs on spin-echo MR scans. In fact, spin-echo imaging is probably more sensitive than MRA for detecting AVMs. Moreover, MRA probably has a limited role in the initial diagnostic workup of AVMs because a conventional angiogram is required anyway. The proper role for MRA will likely be to follow these lesions, to assess the affects of radiation therapy or embolization procedures, or to check for growth of partially resected lesions.
SUMMARY
In summary, MRA produces remarkably good images of the carotid and vertebrobasilar
circulations and the major venous sinuses. Also, MRA can image diseased vessels, and in some
situations it can substitute for more invasive conventional angiography.
![]() At this time, carotid
ultrasound still maintains a primary role for screening carotid bifurcation disease, but MRA is already
making inroads into this area and its use will undoubtedly increase. With proper selection of MRA
techniques and with an understanding of its inherent artifacts and problems, MRA can be an effective
vascular imaging modality.
At this time, carotid
ultrasound still maintains a primary role for screening carotid bifurcation disease, but MRA is already
making inroads into this area and its use will undoubtedly increase. With proper selection of MRA
techniques and with an understanding of its inherent artifacts and problems, MRA can be an effective
vascular imaging modality.
REFERENCES