DIFFUSION & PERFUSION IMAGING
Conventional CT and MR imaging are not sufficiently sensitive to evaluate acute stroke. CT is
perfectly adequate to detect intracranial hemorrhage, but in the case of nonhemorrhagic stroke, the
CT scan may be negative for the first 24 to 36 hours. FLAIR and T2-weighted images can detect
acute stroke by 6 to 12 hours, but most new stroke therapies focus on the first 3 hours after onset.
The ultimate goal for imaging is to define the area of brain infarction and perfusion deficit, and to
identify any ischemic tissue that can be salvaged by medical or surgical therapy. Diffusion-weighted
imaging can detect acute brain infarction within 1 to 2 hours. Perfusion imaging is positive
immediately following an acute stroke.
Diffusion-Weighted Imaging
Diffusion imaging makes use of the variability of “Brownian motion” of water molecules in brain tissue. Brownian motion refers to the random movement of molecules. Water molecules are in constant motion, and the rate of movement or diffusion depends on the kinetic energy of the molecules and is temperature dependent. In biological tissues, diffusion is not truly random because tissue has structure. Cell membranes, vascular structures, and axon cylinders, for example, limit or restrict the amount of diffusion. Also, chemical interactions of water and macromolecules affect diffusion properties. Therefore, in the brain, water diffusion is referred to as “apparent diffusion.”
To obtain diffusion-weighted images, a pair of strong gradient pulses are added to the pulse sequence. The first pulse dephases the spins, and the second pulse rephases the spins if no net movement occurs. If net movement of spins occurs between the gradient pulses, signal attenuation occurs. The degree of attenuation depends on the magnitude of molecular translation and diffusion weighting. The amount of diffusion weighting is determined by the strength of the diffusion gradients, the duration of the gradients, and the time between the gradient pulses.
Diffusion imaging is performed optimally on a high-field (1.5 T) echo-planar system, but it can be accomplished with a turboSTEAM sequence on systems with conventional gradients.
The diffusion data can be presented as signal intensity or as an image map of the apparent diffusion coefficient (ADC). Calculation of the ADC requires 2 or more acquisitions with different diffusion weightings. A low ADC corresponds to high signal intensity (restricted diffusion), and a high ADC to low signal intensity on diffusion-weighted images.
In the setting of acute cerebral ischemia, if the cerebral blood flow is lowered to 10 ml/100gm/min, the cell membrane ion pump fails and excess sodium enters the cell, which is followed by a net
movement of water from the extracellular to intracellular compartment and cytotoxic edema.
Diffusion of the intracellular water molecules is restricted by the cell membranes. The restricted
diffusion results in a decreased ADC and increased signal intensity on diffusion-weighted images.
Severe ischemia can lower the ADC by as much as 56% of normal tissue at 6 hours.
![]()
In patients who present with symptoms of cerebral ischemia, diffusion-weighted images are very
helpful to identify any area of acute ischemia and to separate the acute infarction from old strokes and
other chronic changes in the brain. Only the acute infarcts appear hyperintense on the diffusion
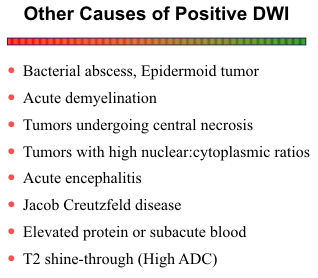
images. Subacute and chronic infarcts,
vasogenic edema, the punctate and confluent
changes of deep white matter ischemia, and
dilated VR spaces are not bright.
![]() Bacterial
abscesses may exhibit restricted diffusion due
to thick cellular debri within the central
cavity. Other diseases of the brain, such as
non-bacterial infections, neoplasia,
contusions, and demyelinating diseases, are
not associated with cytotoxic edema, and
therefore as a rule, they are not hyperintense
on the diffusion images. One exception is
epidermoid tumors, which have restricted
diffusion due to the waxy consistency of their
contents. Also, the central portions of some
primary and secondary brain tumors may
exhibit restriction diffusion as they outgrow
their blood supply and become ischemic.
Occasionally, an acute MS plaque may be mildly hyperintense with diffusion weighting.
Bacterial
abscesses may exhibit restricted diffusion due
to thick cellular debri within the central
cavity. Other diseases of the brain, such as
non-bacterial infections, neoplasia,
contusions, and demyelinating diseases, are
not associated with cytotoxic edema, and
therefore as a rule, they are not hyperintense
on the diffusion images. One exception is
epidermoid tumors, which have restricted
diffusion due to the waxy consistency of their
contents. Also, the central portions of some
primary and secondary brain tumors may
exhibit restriction diffusion as they outgrow
their blood supply and become ischemic.
Occasionally, an acute MS plaque may be mildly hyperintense with diffusion weighting.
Lesions
with prolonged T2 relaxation times are commonly mildly hyperintense on
diffusion-weighted images. This phenomenon of “T2 shine-through” can easily be
distinguished from true restricted diffusion on the ADC map. Only true
restricted diffusion is low signal on the ADC map.
Perfusion Imaging
Measurements of brain perfusion include vascular transit time, cerebral blood volume, and cerebral blood flow. The ultimate goal is absolute cerebral blood flow, but it requires serial analysis of arterial input. Most methods measure relative blood flow and compare the two hemispheres or the individual lobes of the brain for regional differences. Both PET and Xenon CT are good techniques, but neither is widely used. PET requires access to a cyclotron and injection of a radioisotope. Xenon CT can be done on a conventional scanner with some additional hardware and software, but use of the xenon gas is cumbersome and the gas must be disposed of properly.
Vascular transit time and cerebral blood volume are less elegant than cerebral blood flow, but they are useful measurements and can be obtained easily on conventional CT and MR systems with a single bolus injection of contrast material. For CT 40 ml of contrast (300-370 ml I/ml) is injected at a rate of 5-8 ml/sec. Depending on the scanner configuration and number of detector rows, 2-4 sections, 5-10 mm thick are obtained. One image set is acquired per second for 40 seconds. As the bolus of contrast material passes through the cerebral circulation, a transient increase in attenuation or density occurs. A time-density curve is generated for each voxel in each CT slice (see diagram). From the curves, several perfusion image maps can be produced. The time-to-peak (TTP) is the time from the start of the scan until maximum attenuation occurs. The mean transit time (MTT) is the time it takes the contrast bolus to pass from the arterial to the venous side of the cerebral circulation. Assuming a symmetrical attenuation curve, the MTT is measured from the first detection of contrast to the maximum attenuation. The entire area under the curve is a measure of relative cerebral blood volume (rCBV). Finally, a measure of relative cerebral blood flow (rCBF) is calculated by dividing the rCBV by the MTT.
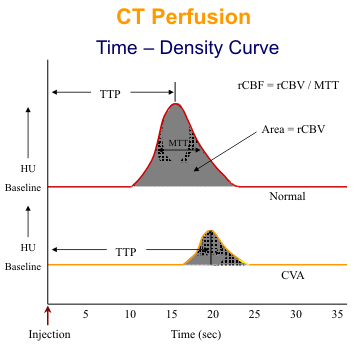
For MR perfusion, 20 ml of gadolinium is injected at 4ml/sec. An echoplanar sequence is used to acquire 10- 15 slices every 2-3 seconds for 40 second acquisition time. As the paramagnetic gadolinium bolus passes through the cerebral circulation, signal attention occurs due to T2* effects. The time- intensity curves for EPI perfusion are similar to the time-density curves for CT except that the curves are inverted.
TTP and MTT are very sensitive to hemodynamic changes in the cerebral circulation. Mild increases of these parameters with normal rCBF and rCBV likely indicate that no brain tissue is at immediate risk of infarction. When progresses arterial obstruction, the rCBF decreases followed by the rCBV. The rCBV initially remains normal or even increases due to autoregulation and dilatation of the capillary bed. If both rCBF and rCBV are reduced, tissue must be assumed. If both parameters are markedly reduced, irreversible ischemia has likely occurred.
Another MR perfusion method is called EPI signal targeting with alternating radiofrequency
(EPISTAR). In-flowing blood is tagged with a 180 degree pulse during alternate acquisitions through
the imaging plane of interest. The tagged and untagged images are subtracted to obtain the blood
volume map.
![]()
Diffusion/Perfusion Mismatch
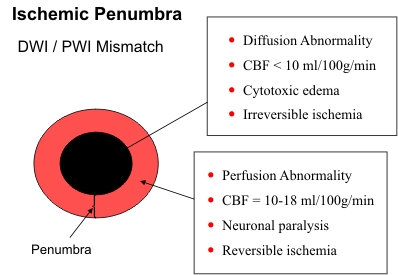
The difference between the diffusion and perfusion abnormalities provide a measure of the ischemic
penumbra or the brain tissue at risk for infarction (see diagram). Restricted diffusion generally
indicates unsalvageable brain tissue
that is destined for infarction. The
perfusion abnormality encompasses
all regions with reduced cerebral
blood flow. If the diffusion
abnormality matches the area of
decreased perfusion, no salvageable
ischemic brain tissue is present. If
the perfusion abnormality is larger
than the area of restricted diffusion,
the difference identifies the region of
reversible ischemia that can be saved
if blood flow is re-established
promptly.
![]()
{To return to cases, use the "Back " button on the Toolbar}